Modern software delivery is a balancing act. Teams strive to move fast, but every shortcut can introduce risk. DevSecOps exists to resolve that tension by embedding security into development workflows without slowing innovation. Yet there’s a catch: you can’t improve what you don’t measure. Metrics are the compass that keeps your DevSecOps journey on course.
The challenge isn’t data scarcity. GitHub and other platforms generate plenty of signals. The challenge is knowing which metrics matter, how to track them effectively, and why they’re worth your attention. In this post, we’ll explore the essential DevSecOps metrics, show how to capture them using GitHub’s capabilities, and explain why these numbers should influence decisions across your organization.
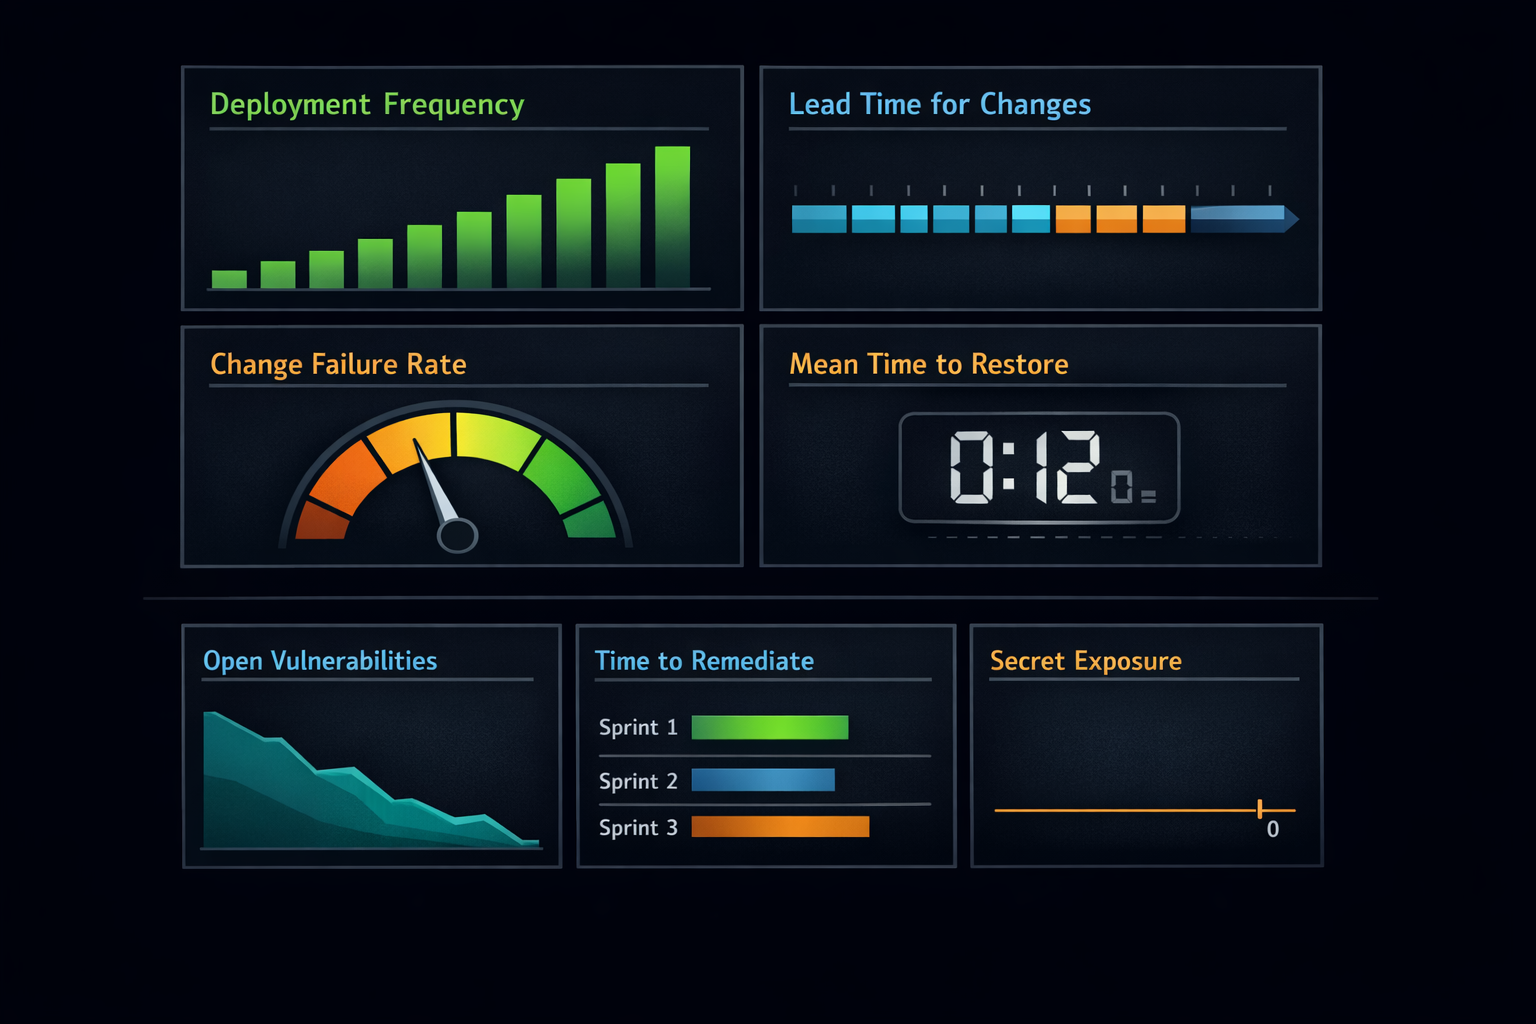
Why Metrics Matter in DevSecOps
Metrics aren’t about policing teams or assigning blame. They’re about creating feedback loops that drive improvement. When developers and security teams see clear, actionable data, they can make better decisions, automate guardrails, and reduce friction. Without metrics, DevSecOps becomes a slogan rather than a practice.
The most impactful metrics align three outcomes: velocity to value, risk reduction, and operational reliability. If you measure only speed, you risk cutting corners. If you measure only security, you risk slowing delivery to a crawl. The goal is balance, that is, fast, safe, and resilient software delivery.
The Core Delivery Signals
High-performing teams track a handful of delivery metrics that reveal how efficiently and safely code moves from idea to production. These are often called DORA metrics, and they’ve become the gold standard for assessing software delivery performance.
Deployment Frequency
Frequent deployments in small batches reduce risk and accelerate feedback. In GitHub, you can track this by querying deployment events tied to protected environments.
# Deployment frequency for production environment (last 30 days)
gh api /repos/<org>/<repo>/deployments \
  -F environment=production \
  --jq '[.[] | select(.created_at > (now - 2592000 | todate))] | length'
Benchmarks: Elite performers deploy multiple times per day (on-demand deployment). High performers deploy between once per day and once per week. Medium performers deploy between once per week and once per month. Low performers deploy less than once per month.
Common Pitfalls: Counting every commit to any branch inflates your numbers without measuring actual production deployment. Measuring deployments to test or staging environments instead of production gives false signals. Including automated dependency updates or infrastructure-only changes that don't deliver user value skews the metric.
How to Improve: Reduce batch size by breaking large features into smaller, independently deployable increments. Automate the entire deployment pipeline to eliminate manual handoffs and approval gates that don't add value. Use feature flags to decouple deployment from release, allowing you to deploy code to production safely without immediately exposing it to users. Establish trunk-based development practices with short-lived branches to reduce integration complexity.
Lead Time for Changes
Shorter lead times indicate healthy pipelines and fewer bottlenecks. GitHub’s GraphQL API lets you correlate commit timestamps with pull request merges and deployment events.
{
  repository(owner: "<org>", name: "<repo>") {
    pullRequests(last: 10, states: MERGED) {
      nodes {
        title
        createdAt
        mergedAt
        commits(first: 1) {
          nodes {
            commit {
              oid
              authoredDate
            }
          }
        }
      }
    }
  }
}
Change Failure Rate
Tag deployment statuses and link them to incident issues or rollback workflows in GitHub Actions.
jobs:
  deploy:
    runs-on: ubuntu-latest
    environment: production
    steps:
      - name: Deploy
        run: ./scripts/deploy.sh
      - name: Emit Deployment Status
        if: always()
        run: |
          jq -n --arg status "${{ job.status }}" \
                --arg dt "$(date -Iseconds)" \
                '{status: $status, timestamp: $dt}' > deploy.json
      - uses: actions/upload-artifact@v4
        with:
          name: deploy-meta
          path: deploy.json
Benchmarks: Elite performers maintain a change failure rate of 0-15% (meaning 85%+ of deployments succeed without causing incidents or requiring rollback). High performers experience 16-30% failure rates. Medium performers see 31-45% failures. Low performers exceed 45% failure rates.
Common Pitfalls: Defining "failure" inconsistently across teams makes comparison meaningless. Some teams count any rollback as failure; others only count customer-impacting incidents. Excluding specific types of changes (configuration updates, database migrations, infrastructure changes) provides an artificially optimistic picture. Not tracking near-misses (issues caught in production monitoring before customer impact) misses opportunities for improvement.
How to Improve: Strengthen your automated testing strategy across the pyramid: unit tests for fast feedback on logic, integration tests for component interactions, contract tests for API compatibility, and end-to-end tests for critical user journeys. Implement progressive delivery techniques like canary deployments (route a small percentage of traffic to new versions), blue-green deployments (maintain parallel environments for instant rollback), and feature flags (enable features gradually for specific user cohorts). Establish comprehensive monitoring with Service Level Indicators (SLIs) that detect degradation before customers notice. Conduct blameless postmortems after failures to identify systemic improvements rather than individual blame.
Mean Time to Restore
GitHub issues and deployment logs provide the timestamps you need to calculate MTTR.
Benchmarks: Elite performers restore service in less than one hour. High performers recover in less than one day. Medium performers require between one day and one week. Low performers take more than one week to restore service after an incident.
Common Pitfalls: Starting the clock when someone begins working on the problem rather than when the incident actually occurred understates your true MTTR. Stopping the clock when a fix is deployed rather than when service is fully restored to customers gives false confidence. Excluding incidents that resolve themselves (transient failures, auto-scaling responses) or only counting "major" incidents creates blind spots.
How to Improve: Invest in observability to detect issues faster. Structured logging with correlation IDs, distributed tracing across services, and real-time dashboards showing business and technical metrics reduce time to detection. Practice incident response through game days and chaos engineering experiments so teams know their playbooks when real incidents occur. Automate rollback procedures so reverting to known-good states takes seconds, not hours. Reduce deployment size and complexity so understanding the blast radius of changes is straightforward. Establish clear escalation paths and on-call rotations with runbooks that guide responders through common scenarios. Most importantly, conduct blameless postmortems that focus on improving systems rather than punishing individuals. Psychological safety is essential for honest learning.
Security Metrics That Drive Action
Velocity is only half the story. DevSecOps is about embedding security into the development process, and that means measuring how effectively you identify and remediate risks. GitHub Advanced Security (GHAS) offers powerful signals here.
Open Vulnerabilities and Aging
# Code scanning alerts by severity and age
gh api /repos/<org>/<repo>/code-scanning/alerts \
  --jq '.[] | {rule_id, severity, created_at, dismissed_at, fixed_at}'
Industry Benchmarks: High-performing teams maintain fewer than 10 critical vulnerabilities open at any time and resolve critical findings within 24-48 hours. Medium performers may carry 10-50 open critical issues with resolution times of 1-2 weeks. Low performers accumulate hundreds of open vulnerabilities with remediation measured in months.
What "Good" Looks Like: Your critical and high-severity vulnerability count trends downward over time. No critical vulnerability remains open longer than your SLA (typically 7 days). You have zero known vulnerabilities older than 90 days. Your backlog of medium and low-severity findings decreases quarter over quarter, indicating you're not just fixing new issues but addressing technical debt.
Common Measurement Challenges: False positives inflate your numbers and erode trust in scanning tools; invest time tuning rules and suppressing noise. Not all vulnerabilities are exploitable in your context; consider exploitability and reachability analysis rather than counting every theoretical issue. Alert fatigue sets in when teams see hundreds of findings; prioritize ruthlessly by severity, exploitability, and business impact.
Time to Remediate
Track created and resolved timestamps on alerts to measure how quickly vulnerabilities are fixed.
Industry Benchmarks: Elite security programs remediate critical vulnerabilities within 24 hours and high-severity issues within 7 days. Medium and low-severity findings should be addressed within 30 and 90 days respectively. Organizations with mature DevSecOps practices often achieve median remediation times under 5 days for all severities.
What "Good" Looks Like: Your remediation time consistently meets or beats your internal SLAs. The time-to-fix decreases as your team builds muscle memory and automation around common vulnerability patterns. You measure time from discovery to deployed fix, not just time to code commit. You differentiate between remediation (actually fixing the vulnerability) and mitigation (implementing compensating controls), tracking both separately.
Common Measurement Challenges: Disagreement about when the clock starts: is it when the scanner first detects the issue, when a ticket is created, or when a human triages it? Ambiguity about when it stops: when code is merged, when it's deployed to production, or when the scanner confirms the fix? Dismissed or "won't fix" vulnerabilities skew averages if not handled separately. Dependency vulnerabilities where you're waiting for upstream maintainers require different measurement approaches than code you control.
Dependency Health
# Dependabot alerts aging
gh api /repos/<org>/<repo>/dependabot/alerts \
  --jq '.[] | {package: .dependency.package.name, severity, created_at, dismissed_at}'
Industry Benchmarks: Organizations with strong supply chain security maintain zero critical dependency vulnerabilities in production code and keep 95%+ of dependencies up to date within one major version of current releases. They track dependency age and proactively update libraries before vulnerabilities are announced. A healthy dependency refresh rate is monthly for patch updates and quarterly for minor version updates.
What "Good" Looks Like: Your dependency alert count trends toward zero over time. You have automated processes (like Dependabot) that propose updates regularly, and your team merges them quickly. You maintain an inventory of all dependencies including transitive ones. Critical dependencies have identified maintainers and fallback plans if projects are abandoned. You've eliminated dependencies with known vulnerabilities older than 30 days.
Common Measurement Challenges: Transitive dependencies (dependencies of your dependencies) are invisible to many teams but represent significant risk. Not all updates are straightforward: breaking changes require testing and refactoring effort that's hard to predict. Alert fatigue when automated tools propose dozens of updates weekly; teams need filtering and prioritization logic. License compliance issues get conflated with security issues, creating confusion about what needs immediate action.
Secret Exposure Prevention
# Secret scanning alerts
gh api /repos/<org>/<repo>/secret-scanning/alerts \
  --jq '.[] | {secret_type, state, created_at, resolved_at}'
Industry Benchmarks: Best-in-class organizations maintain zero exposed secrets in their repositories at any given time. When secrets are accidentally committed, they're revoked within 1 hour and rotated immediately. The occurrence rate should trend toward zero as teams adopt secret management solutions and pre-commit hooks. Organizations with mature secret hygiene see fewer than 1 secret exposure per 1000 commits.
What "Good" Looks Like: You have automated secret scanning on every push, with immediate notifications to committers and security teams. Exposed secrets are automatically revoked through integration with secret management platforms (AWS Secrets Manager, Azure Key Vault, HashiCorp Vault). Your team uses environment variables, secrets management tools, and encrypted configuration files instead of hardcoding credentials. Developers are trained to recognize secrets and use tooling (like git-secrets or detect-secrets) locally before pushing code.
Common Measurement Challenges: False positives from test credentials, dummy API keys, and string patterns that look like secrets but aren't. Historical secrets in old commits that can't be removed without rewriting git history, creating tension between security and traceability. Secrets in configuration files that change format or location, requiring constant tuning of detection rules. Third-party integrations that generate tokens automatically, creating alert noise if not properly categorized. Determining when a secret was truly exposed (commit time, push time, or PR merge time) affects measurement and response urgency.
Why These Numbers Matter to the Business
Deployment frequency and lead time show whether your investment in automation and CI/CD is paying off. Change failure rate and MTTR reveal the true cost of speed and the resilience of your systems. Vulnerability aging and remediation time demonstrate security posture and compliance readiness. Dependency health and secret scanning metrics protect against supply chain attacks and catastrophic breaches.
For executives, these numbers translate into risk and cost. Faster recovery means less downtime and happier customers. Shorter lead times mean quicker delivery of features and revenue opportunities. For security leaders, remediation metrics provide evidence of policy adherence and help prioritize resources. For developers, clear feedback loops reduce friction and make security part of the daily workflow rather than an afterthought.
Building a Governance Framework Around Metrics
Collecting data is not enough. Enterprises need a governance model that defines who owns these metrics, how often they’re reviewed, and what actions follow. Successful organizations establish oversight domains (platform teams, security councils, centers of excellence) and create a cadence for reviewing risk and reliability trends.
Here’s an example of a nightly export workflow:
# .github/workflows/security-export.yml
on:
  schedule:
    - cron: "0 2 * * *"
jobs:
  export:
    runs-on: ubuntu-latest
    permissions:
      security-events: read
      contents: read
    steps:
      - name: Export code scanning alerts
        run: gh api /repos/$ORG/$REPO/code-scanning/alerts > code-alerts.json
      - name: Export dependabot alerts
        run: gh api /repos/$ORG/$REPO/dependabot/alerts > dep-alerts.json
      - name: Export secret scanning alerts
        run: gh api /repos/$ORG/$REPO/secret-scanning/alerts > secret-alerts.json
      - uses: actions/upload-artifact@v4
        with:
          name: security-alerts
          path: "*.json"
Putting It All Together
DevSecOps is not a destination; it’s a continuous improvement journey. Metrics are the map that keeps you on course. By focusing on a handful of meaningful signals, such as deployment frequency, lead time, change failure rate, MTTR, vulnerability remediation, dependency health, and secret exposure, you can balance speed and security without sacrificing either.
GitHub makes it possible to track these metrics without adding friction. With built-in dashboards, APIs, and automation workflows, you can turn raw data into actionable insights. The challenge is cultural: using metrics to drive learning and improvement, not blame. When teams see metrics as a tool for empowerment, DevSecOps becomes more than a buzzword, it becomes a competitive advantage.
Next Steps for Readers
Start small. Pick two or three metrics that matter most to your organization and implement the queries and workflows shared here. Build a central repository for data exports and dashboards. Establish a monthly review cadence with platform and security teams. Over time, expand your coverage and automate more of the process. The payoff is worth it: faster delivery, stronger security, and greater confidence in every release.
Need help understanding your metrics or putting together meaningful reports to help you take you DevSecOps game from good to great? Email me!