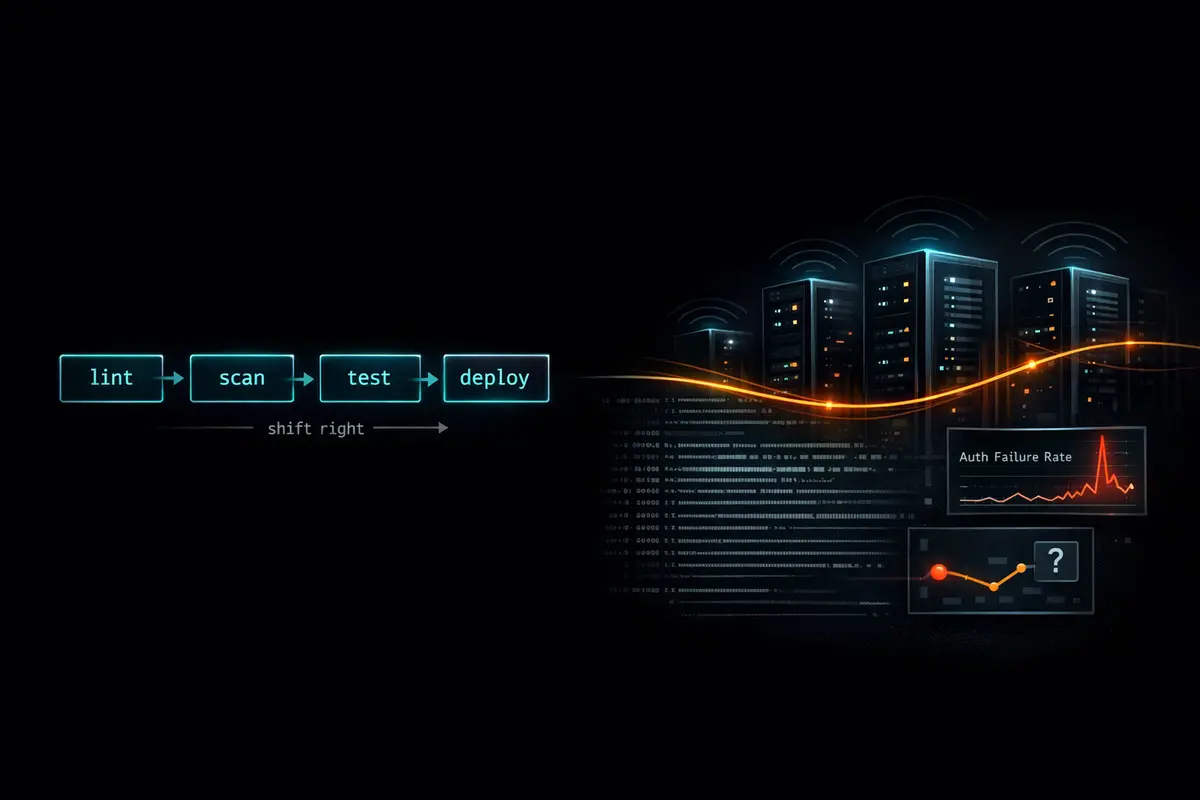
Shift left is right. Catch vulnerabilities in code review, in CI, in dependency scanning - before they ship. The DevSecOps community has invested heavily here and the tooling is genuinely good. But shift left has a blind spot: it only covers the attack surface you anticipated. Attackers don't respect your threat model. They operate in production, against live systems, exploiting behavior that passed every scan because it wasn't a vulnerability until it was combined with a specific runtime condition, a specific data pattern, or a specific sequence of requests. The answer isn't to abandon shift left - it's to complement it with shift right: instrumentation in production that makes anomalous behavior visible before it becomes an incident.
The reason this gets skipped is understandable. Shift-left tooling is largely automatic - you plug in Dependabot, add a CodeQL workflow, and the scans run without anyone thinking about them. Shift-right requires decisions: what to instrument, what thresholds to set, where to route alerts, how to avoid drowning your team in noise. Those decisions aren't hard, but they require intention. This post makes the argument for doing it, shows how to instrument a Node.js service with OpenTelemetry for security-relevant signals, and routes those signals into GitHub Security alerts - where your team is already reviewing Dependabot and CodeQL findings - so the operational overhead stays close to zero.
Observability Data and Security Data Are the Same Data
Here is the core argument: everything your security team wants to see in a SIEM is already flowing through your observability stack. The difference is framing and threshold, not source.
- A spike in 4xx errors might be a bug. It might be credential stuffing.
- Unusual outbound connections might be a misconfigured integration. They might be C2 beacon traffic.
- A process spawning a child process might be a legitimate job runner. It might be a shell injection exploit in progress.
- Authentication failures at 3am from a single IP might be a developer locked out. It might be a brute-force attempt.
None of these interpretations require different data. They require different context and different thresholds applied to the same stream. Most organizations run separate tooling for observability (Datadog, Grafana, OpenTelemetry collectors) and security (SIEM, GitHub Security alerts, Dependabot). They are looking at the same signals twice through different products, paying twice, and - critically - the integration between the two stacks is usually manual, asynchronous, and owned by nobody. The better model is to define security-relevant thresholds inside your observability instrumentation and route high-severity signals to security tooling directly.
Observability asks: "What is my system doing right now?" Security asks: "Is my system being abused right now?" At the production layer, these questions share an answer.
The Three Signal Categories Worth Instrumenting for Security
Not everything in your telemetry is security-relevant. The goal is not to route all traces into a SIEM - it's to identify the narrow set of signals where an anomaly is evidence of abuse rather than just a bug. Three categories cover most of what matters for a typical web application.
Authentication and Authorization Signals
Failed logins are the most observable leading indicator of account-based attacks. What to track:
- Failed authentication attempts - rate, source IP, target account
- Successful auth after N prior failures - credential stuffing success signal; this is the event that matters most
- Privilege escalation events - role changes, permission grants, admin flag toggles
- Token anomalies - same token presented from multiple distinct IPs, token used after recorded revocation
The trick with auth signals is baselining. A handful of failed logins per hour is normal. Fifty from a single IP over five minutes is not. Establish a 30-day rolling baseline for failed auth rate per hour, alert when the current rate exceeds 3× baseline sustained for five or more minutes. This single threshold eliminates the noise from developers mistyping their passwords while catching the early ramp of a stuffing attack.
Outbound Connection Patterns
Server-side applications have a predictable set of outbound destinations. Your API calls GitHub, Slack, maybe a payment processor. That list changes infrequently and is known in advance. An unexpected outbound connection is anomalous by definition - it doesn't require a baseline, because the baseline is your allowlist.
What to track:
- Outbound connections to new or unknown hosts - first-time destinations not on the allowlist
- DNS resolution of domains outside the allowlist - catches connections that haven't been made yet
- Data volume spikes on established outbound connections - potential exfiltration even to a known destination
This pattern is particularly high-value because it catches post-exploitation activity. An attacker who has achieved code execution in your application will eventually try to beacon home or exfiltrate data. The outbound connection is often the first observable evidence.
Process and Runtime Behavior
For Node.js specifically, child_process.exec and child_process.spawn with user-controlled input are a common injection vector. Logging every process spawn with its full argument list is cheap - the events are rare in a healthy application - and the signal-to-noise ratio when something anomalous appears is excellent.
What to watch for:
- Unexpected child process spawns, especially shell interpreters:
sh,bash,cmd.exe,powershell.exe - File system writes to locations outside expected application directories - binaries dropping to
/tmp, writes to cron directories - Memory usage anomalies - some exploit payloads and deserialization attacks cause distinctive heap growth patterns
A Node.js web application should almost never spawn a shell. If one appears in your process spawn log, that is not a false positive you tune away - it is the beginning of an incident response.
Instrument spawns by wrapping child_process.spawn at a single callsite in your application:
// lib/safe-spawn.js
import { spawn as _spawn } from 'child_process';
import { trace } from '@opentelemetry/api';

const SHELL_INTERPRETERS = new Set(['sh', 'bash', 'zsh', 'cmd.exe', 'powershell.exe', 'pwsh']);

export function spawn(command, args = [], options = {}) {
  const fullCommand = [command, ...args].join(' ');
  const isShell = SHELL_INTERPRETERS.has(command);

  console.log(JSON.stringify({
    level: isShell ? 'error' : 'info',
    event: 'process.spawn',
    command,
    args: args.join(' '),
    is_shell: isShell,
    timestamp: new Date().toISOString(),
  }));

  const span = trace.getActiveSpan();
  if (span) {
    span.setAttributes({
      'process.spawn.command': command,
      'process.spawn.args': args.join(' '),
      ...(isShell && { 'security.anomaly': 'shell_spawn', 'security.severity': 'high' }),
    });
  }

  return _spawn(command, args, options);
}
Use lib/safe-spawn.js everywhere in your application instead of importing child_process directly - the wrapper is a eslint rule away from being enforced (no-restricted-imports).
Instrumenting a Node.js App with OpenTelemetry
OpenTelemetry's auto-instrumentation handles the baseline - HTTP spans, framework-level timing, error tracking - without code changes. The security-relevant work is adding custom attributes to existing spans and emitting structured logs alongside them.
Install the core packages:
npm install @opentelemetry/sdk-node \
  @opentelemetry/auto-instrumentations-node \
  @opentelemetry/exporter-otlp-http
Bootstrap the SDK - load this before anything else using --require ./instrumentation.js. Using spanProcessors explicitly lets you compose the export pipeline with custom processors (the OutboundAnomalyProcessor defined below):
// instrumentation.js
import { NodeSDK } from '@opentelemetry/sdk-node';
import { getNodeAutoInstrumentations } from '@opentelemetry/auto-instrumentations-node';
import { OTLPTraceExporter } from '@opentelemetry/exporter-otlp-http';
import { BatchSpanProcessor } from '@opentelemetry/sdk-trace-node';
import { OutboundAnomalyProcessor } from './processors/outbound-anomaly.js';

const exporter = new OTLPTraceExporter({
  url: process.env.OTEL_EXPORTER_OTLP_ENDPOINT,
});

const sdk = new NodeSDK({
  spanProcessors: [
    new BatchSpanProcessor(exporter),   // normal export pipeline
    new OutboundAnomalyProcessor(),     // security annotation layer
  ],
  instrumentations: [
    getNodeAutoInstrumentations({
      '@opentelemetry/instrumentation-http': { enabled: true },
      '@opentelemetry/instrumentation-express': { enabled: true },
    }),
  ],
});

sdk.start();
Add security-relevant attributes in your auth middleware:
// middleware/auth.js
import { trace, SpanStatusCode } from '@opentelemetry/api';

export function authMiddleware(req, res, next) {
  const span = trace.getActiveSpan();

  if (span) {
    span.setAttributes({
      'auth.method': req.headers['authorization'] ? 'bearer' : 'none',
      'auth.ip': req.ip,
      'auth.user_agent': req.headers['user-agent'] ?? 'unknown',
    });
  }

  // ... auth logic
  if (authFailed) {
    span?.setAttributes({ 'auth.failure_reason': 'invalid_credentials' });
    span?.setStatus({ code: SpanStatusCode.ERROR, message: 'auth_failure' });

    // Structured log alongside the span - queryable by your log aggregator
    console.log(JSON.stringify({
      level: 'warn',
      event: 'auth.failure',
      ip: req.ip,
      target: req.body?.username ?? 'unknown',
      timestamp: new Date().toISOString(),
    }));
  }

  next();
}
Flag unknown outbound destinations using a custom span processor. OpenTelemetry's HTTP auto-instrumentation captures outbound calls automatically; this processor adds a security annotation when the destination isn't recognized:
// processors/outbound-anomaly.js
const KNOWN_DESTINATIONS = new Set([
  'api.github.com',
  'hooks.slack.com',
  // ... your known outbound hosts
]);

export class OutboundAnomalyProcessor {
  onStart(span, _parentContext) {
    const host = span.attributes['net.peer.name'];
    if (host && !KNOWN_DESTINATIONS.has(host)) {
      span.setAttributes({
        'security.anomaly': 'unknown_outbound_destination',
        'security.severity': 'medium',
      });
      console.log(JSON.stringify({
        level: 'warn',
        event: 'outbound.unknown_destination',
        host,
        timestamp: new Date().toISOString(),
      }));
    }
  }
  onEnd() {}
  shutdown() { return Promise.resolve(); }
  forceFlush() { return Promise.resolve(); }
}
Register the processor in your SDK config by passing it to spanProcessors alongside the exporter. The onStart hook fires before the span is exported, so the attribute is visible in both your trace backend and your log stream.
Routing Security Signals to GitHub Security Alerts
Your team already reviews Dependabot and CodeQL findings in the GitHub Security tab. Routing runtime signals to the same interface means one fewer tool to check and no new alerting channel to maintain. GitHub's Code Scanning API accepts SARIF (Static Analysis Results Interchange Format) - a JSON schema that was designed for static analysis but works equally well as a transport for runtime anomaly results.
A GitHub Actions workflow to ingest a batch of security signals:
name: Ingest Security Signals
on:
  workflow_dispatch:
    inputs:
      signals_file:
        description: 'Path to security signals JSON file'
        required: true

permissions:
  security-events: write
  contents: read

jobs:
  ingest:
    runs-on: ubuntu-latest
    steps:
      - uses: actions/checkout@v4

      - name: Convert signals to SARIF
        id: convert
        run: |
          node scripts/signals-to-sarif.js \
            --input "${{ inputs.signals_file }}" \
            --output security-signals.sarif

      - name: Upload SARIF to GitHub Security
        uses: github/codeql-action/upload-sarif@v3
        with:
          sarif_file: security-signals.sarif
          category: runtime-security
The category: runtime-security field keeps runtime signals visually separated from your static analysis results in the Security tab. The SARIF your conversion script emits needs to be schema-valid - here is the minimal structure for an auth failure spike result:
{
  "version": "2.1.0",
  "runs": [{
    "tool": {
      "driver": {
        "name": "runtime-security",
        "rules": [{
          "id": "auth-failure-spike",
          "name": "AuthenticationFailureSpike",
          "shortDescription": { "text": "Elevated authentication failure rate" },
          "defaultConfiguration": { "level": "warning" }
        }]
      }
    },
    "results": [{
      "ruleId": "auth-failure-spike",
      "message": { "text": "Auth failure rate 4.2x baseline for 8 minutes from 203.0.113.42" },
      "level": "warning",
      "locations": [{
        "physicalLocation": {
          "artifactLocation": { "uri": "src/middleware/auth.js" }
        }
      }]
    }]
  }]
}
The physicalLocation.artifactLocation.uri maps the alert to the relevant source file - the auth middleware, the HTTP client wrapper, wherever the instrumented code lives. GitHub uses this to anchor the alert in code review context.
The signals-to-sarif.js conversion script reads a newline-delimited JSON file of signal objects emitted by your application (each line: { ruleId, message, level, uri }) and produces the SARIF document:
// scripts/signals-to-sarif.js
import { readFileSync, writeFileSync } from 'fs';
import { parseArgs } from 'util';

const { values } = parseArgs({
  options: {
    input:  { type: 'string' },
    output: { type: 'string' },
  },
});

const signals = readFileSync(values.input, 'utf8')
  .trim().split('\n').map(line => JSON.parse(line));

const ruleIds = [...new Set(signals.map(s => s.ruleId))];

const sarif = {
  version: '2.1.0',
  runs: [{
    tool: {
      driver: {
        name: 'runtime-security',
        rules: ruleIds.map(id => ({
          id,
          name: id.replace(/-([a-z])/g, (_, c) => c.toUpperCase()),
          shortDescription: { text: id },
          defaultConfiguration: { level: 'warning' },
        })),
      },
    },
    results: signals.map(s => ({
      ruleId: s.ruleId,
      message: { text: s.message },
      level: s.level ?? 'warning',
      locations: [{ physicalLocation: { artifactLocation: { uri: s.uri } } }],
    })),
  }],
};

writeFileSync(values.output, JSON.stringify(sarif, null, 2));
console.log(`Wrote ${signals.length} signal(s) to ${values.output}`);
Your runtime alerting code (rate-threshold logic, correlation checks) writes to the signals file; this script is the schema adapter. Keep them separate - the converter is stateless and easy to test; the threshold logic is where the real decisions live.
Defining Thresholds That Distinguish Abuse from Bugs
The hardest part of runtime security alerting is the signal-to-noise ratio. Alert on everything anomalous and the team stops reading alerts within a week. Alert on nothing and the whole exercise is a waste of instrumentation work. A practical framework has two layers.
Rate-based thresholds apply to signals with a predictable normal distribution - auth failures, error rates, request volume:
- Establish a 30-day rolling baseline per metric
- Alert at 3× baseline sustained for 5+ minutes - this filters transient spikes from deploys and traffic bursts
- Page at 10× baseline sustained for 2+ minutes - this is almost certainly not normal traffic under any reasonable interpretation
Novelty-based thresholds apply to signals that should be near-zero in a healthy application - no baseline required:
- First occurrence of a new outbound destination: medium alert
- First occurrence of a process spawn with a shell interpreter: high alert immediately (this should not happen in a Node.js web server)
- First successful auth from an IP that had 10+ prior failures in the preceding hour: high alert
Correlation is where the signal-to-noise math actually improves. Single anomalous events are noisy - each one has plausible innocent explanations. Two correlated anomalies from the same source within a short window have very few:
- Auth failure spike from IP X and successful auth from IP X within 30 minutes → credential stuffing success, critical
- Error rate spike and unknown outbound connection and new process spawn within the same 5-minute window → potential active exploit, critical
Correlation is the difference between alert fatigue and actionable detection. Build it into your threshold logic before you go live with alerting.
Shift-Right Implementation Checklist
- [ ] Install OpenTelemetry with
@opentelemetry/auto-instrumentations-node- baseline HTTP and framework spans are free - [ ] Add security-relevant attributes to auth spans: IP, user agent, failure reason
- [ ] Log every auth failure as structured JSON (not free-text) - machines need to count these
- [ ] Build a known-destinations allowlist and use
OutboundAnomalyProcessorto flag first-time outbound connections - [ ] Log every
child_processspawn with full argument list - [ ] Define 30-day rolling rate baselines for auth failures and error rates
- [ ] Set alert thresholds at 3× baseline sustained for 5 minutes; page at 10×
- [ ] Add correlation rules: auth spike + auth success from same IP; error spike + unknown outbound + process spawn
- [ ] Route high-severity signals to GitHub Security via SARIF upload with
category: runtime-security - [ ] Review security signal alerts in the same workflow as Dependabot and CodeQL - same interface, same team, same weekly review cadence
Shift left is necessary. It is not sufficient. Every security posture has a boundary where it stops - and for shift-left tooling, that boundary is the production environment. Attackers don't respect that boundary. They operate where your SAST scanner doesn't run, where your dependency auditor has no visibility, where the only evidence of compromise is a pattern in your logs that nobody was watching for.
Observability instrumentation doesn't require a dedicated security team or a SIEM contract. It requires structured logging, OpenTelemetry, a set of thresholds, and the discipline to review alerts in the same tool where you review everything else. The shift is small. The coverage gap it closes is not.
Questions about OpenTelemetry instrumentation strategy, threshold design, or wiring runtime signals into your existing GitHub security workflow? Reach out.